Sonoma County Breeding Bird Atlas
Sonoma County Breeding Bird Atlas
It took four more years for the data from this first Atlas to be compiled and printed in book form.
Click here for a pdf copy of the original report.
"The 1995 Breeding Bird Atlas (BBA) proved to be a remarkably useful and important baseline for the status of our birds. Government agencies and companies who were responsible for developing environmental impact statements and reviews warmly welcomed our BBA. Which birds breed in Sonoma County, where and by inference what habitats they use were all included in the Atlas and were of vital importance in establishing a baseline for reference. Contractors and others involved in disturbance of possible breeding habitats have been able to avoid legal challenges and public relations problems by avoiding disruption of active nests through use of the dates of active breeding data included for each bird in the BBA."2
The beginnings of the Second Breeding Bird Atlas
One of the main values of an atlas is the possibility of comparing this baseline data with data from future studies. At its September 1992 meeting, the North American Ornithological Atlas Committee (NORAC) recommended repeating atlas studies every 25 years. Madrone members took that suggestion to heart, and started the second Atlas in 2011, completing it in 2016.
Breeding Atlas surveys have been conducted in Britain and parts of the United States since the late 1970's. The purpose of an Atlas is to acquire baseline data on the species of birds that breed in a certain area; in our case, Sonoma County. As with other Atlases, the entire county was divided into five kilometer (about three miles) square blocks in the 1980's in preparation for our first Atlas, for which the breeding bird survey work was completed between 1986 and 1991.
A lot has happened in the last 25 years. Sonoma County's population in 1991 was 397,937. In 2015, it had grown to 500,292, an increase of over 125%. This increased population pressure and subsequent development has affected native species that reside in the county by reducing the habitat available to many of them for feeding and nesting. Other factors, such as the recent drought, climate change, new introduced species, and others, all have an effect on the birds that we know and love.
We can look at some figures from both Atlases to get an idea of some of the changes, but first, a note of caution: at the moment, comparing the two survey results is a bit like comparing apples and oranges (or Kinglets and Vireos, if you prefer). Both are similar, but there are differences that need to be factored in. In the first survey, there were 105 volunteers who spent 3,962 hours out in the field in the Atlas blocks, observing all of the birds they saw during the breeding season. In the second survey, there were 106 volunteers (some of them participated in both surveys), who spent 8,989 hours in the field, well over twice as many hours! Somehow, that will need to be adjusted for, as more time spent in the field usually (not always) leads to more observations, so it can look like we actually found more birds breeding, when what really happened was we had more time to find the ones that were already there.
Comparing the First (1991) and Second (2016) Atlases
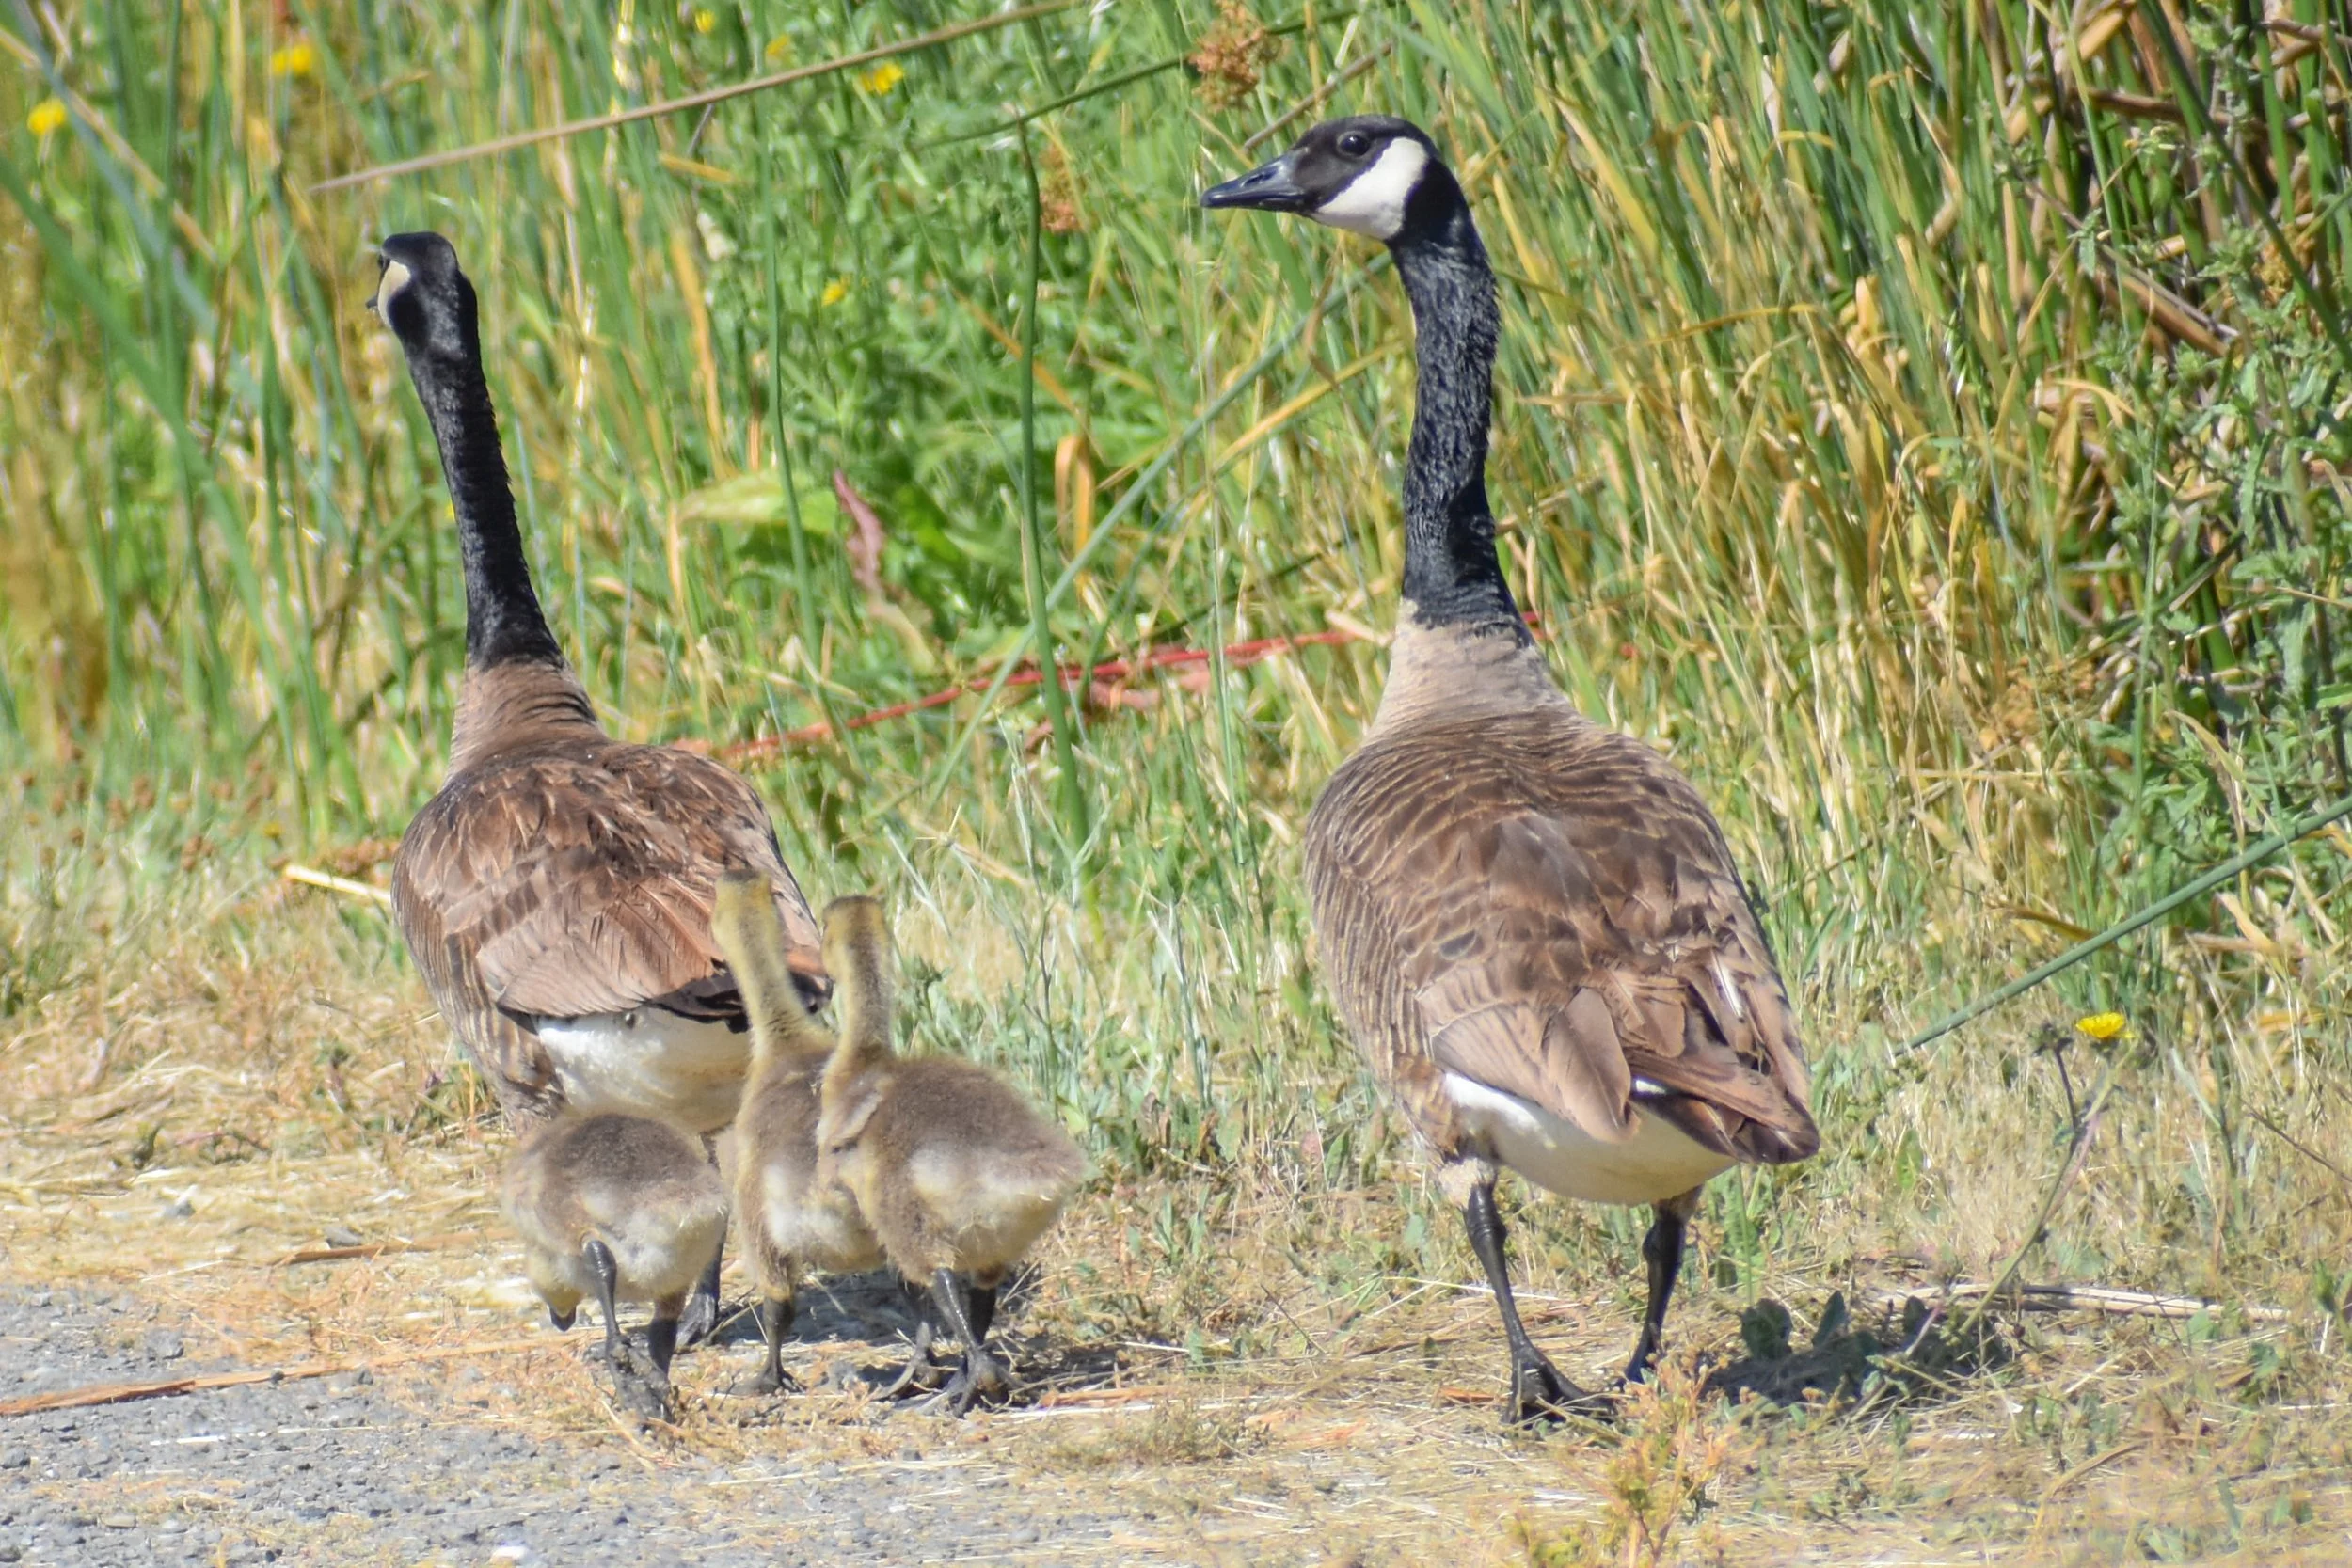
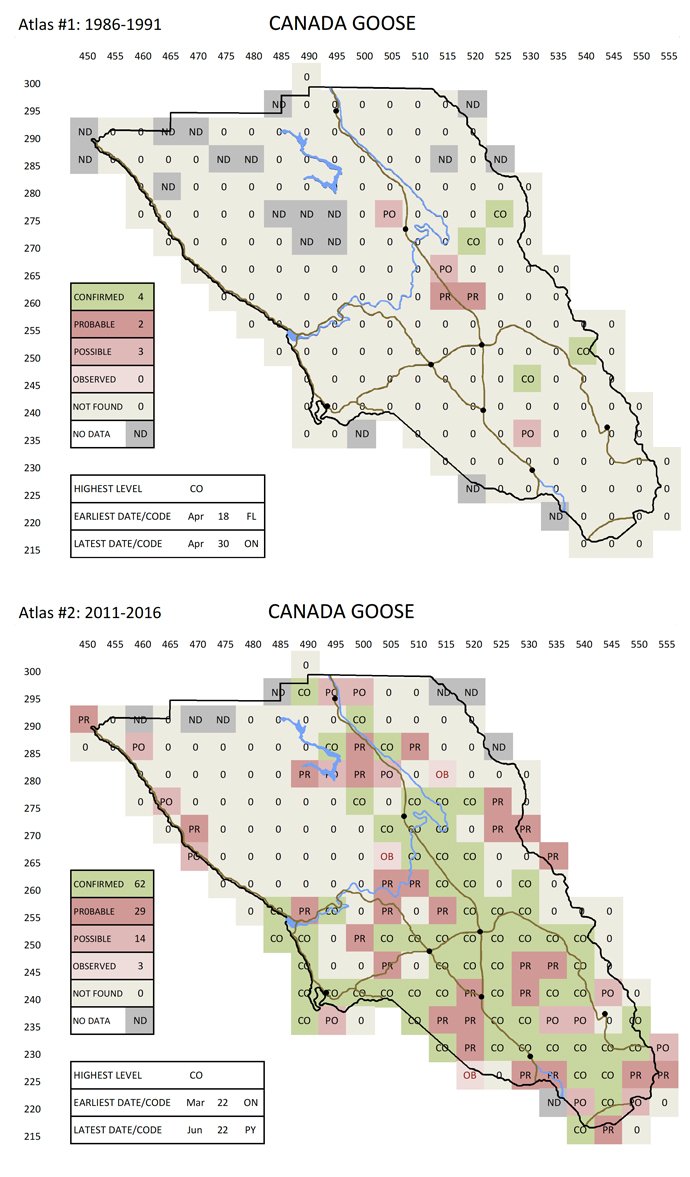
Canada Goose
Partly due to the increased hours of surveying during the second Atlas, many bird species were confirmed in more blocks, compared to the first Atlas. The species with the greatest increase was the Canada Goose. There may be other reasons for the increase in the number of blocks they were found nesting in, such as the construction of more golf courses with ponds, and other habitats that they prefer.